Precision Soil Analysis
The various soil types and produce that can be grown have unique nutrient needs and therefore require different management techniques when it comes to fertilizing. Years of continuous fertilizing without monitoring the soil composition to identify the deficiencies and surpluses can lead to imbalances of soil elements and have an effect on harvests yielded. The goal, therefore, is to identify and analyse the different soil elements and make the necessary allowances in order to effectively manage soil preparation for optimum production.
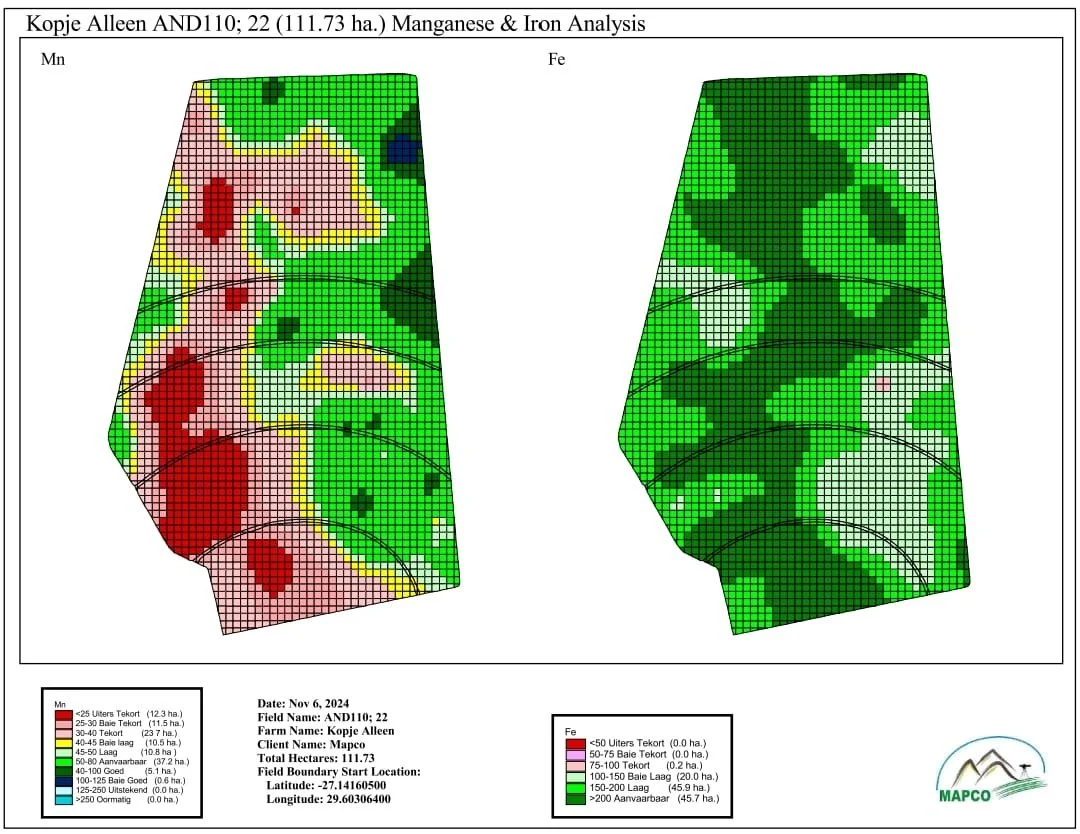
Soil samples are taken on a grid system of 1 Ha for fields and 50x50m or 75x75m for vineyards or orchards. The sample is taken at a depth of 30cm in between rows in order to do a precision analysis of macro elements which include pH, P Bray, K, Ca, Mg, Na, Clay % and acid saturation %. Once all the needed samples have been gathered and labelled, we send it to a reputable, independent laboratory with a world class analytical facility. The laboratory is a member of AgriLASA and follows recognized methods of analyses. After we receive the analysis, we are able to work with the results and produce colour maps for each land, per element using our precision analysis software. Colour recommendation maps for lime, Kcl50 and supers can also be supplied on request
Farm Surveying

Having a farm map can be a very useful tool. The correct calculation of arable land (hectares) helps with cost effective fertiliser, seed and pesticide control inputs. Once camp size is determined, the camp’s optimal grazing capabilities can also be calculated and thereby resulting in the correct control of livestock numbers and prevention of overgrazing.
Using a DGPS in WGS84 format all features, structures and improvements within borderlines and above ground are surveyed and plotted. Features and structures include windmills, water-taps, pumps, troughs, corrals, gates etc. We make use of the National Geo-Spatial Information database supplied by the Rural Development & Land Reform to accurately reflect land gradient. Perennial water and dam-lines are similarly determined and reflected.